By Audrey Gerred
I was today years old when I learned that I can add emojis as values in Power BI! Why is this tidbit of knowledge even important, you ask? Well… what if you wanted to have field parameters as a slicer on your canvas and you wanted to have the values ‘color coded’ based on what dimension table they are related to so that users could look at it and easily identify ‘groups’ of dimensions. Conditional formatting is not an option in the slicer visual, but we can still achieve something similar (and easier to read since the text is going to stay black, IMHO).
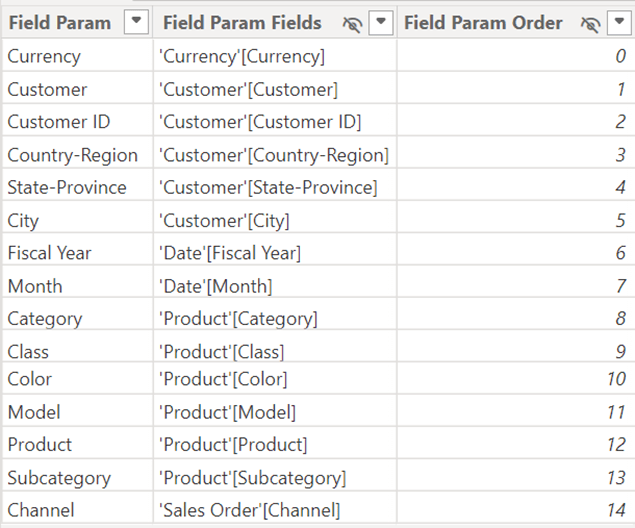
Assuming you already have a field parameter table, you can add a new column that will add emojis to each row. For my example, I am using the Adventure Works semantic model and I have a Field Parameter table like below:
Now, I want to have a color for each ‘grouping’ of dimensions (i.e. Currency, Customer, Date, Product, and Sales Order). To do this, I create a new column using the following DAX:
Format Label =
SWITCH(
TRUE(),
‘Field Param'[Field Param] IN {“Currency”}, “🟡”,
‘Field Param'[Field Param] IN {“Customer”, “Customer ID”, “Country-Region”, “State-Province”, “City”}, “🔴”,
‘Field Param'[Field Param] IN {“Fiscal Year”, “Month”}, “🔵”,
‘Field Param'[Field Param] IN {“Category”, “Class”, “Color”, “Model”, “Product”, “Subcategory”}, “🟣”,
‘Field Param'[Field Param] IN {“Channel”}, “⚫”,
“🟢”
)
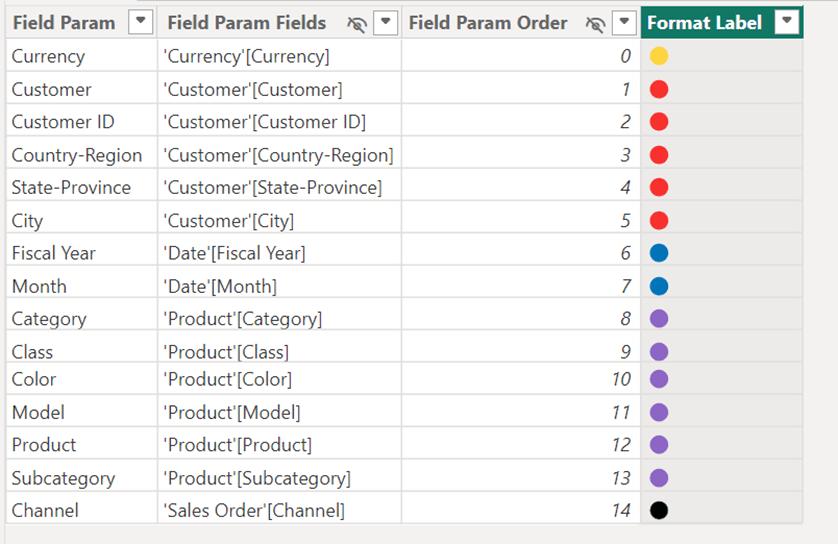
Once this is complete, my field parameter table looks like this:
The next step is to create a column that concatenates the Format Label field with the Field Param field:
Field Param with Color Coding = ‘Field Param'[Format Label] & ” ” & ‘Field Param'[Field Param]
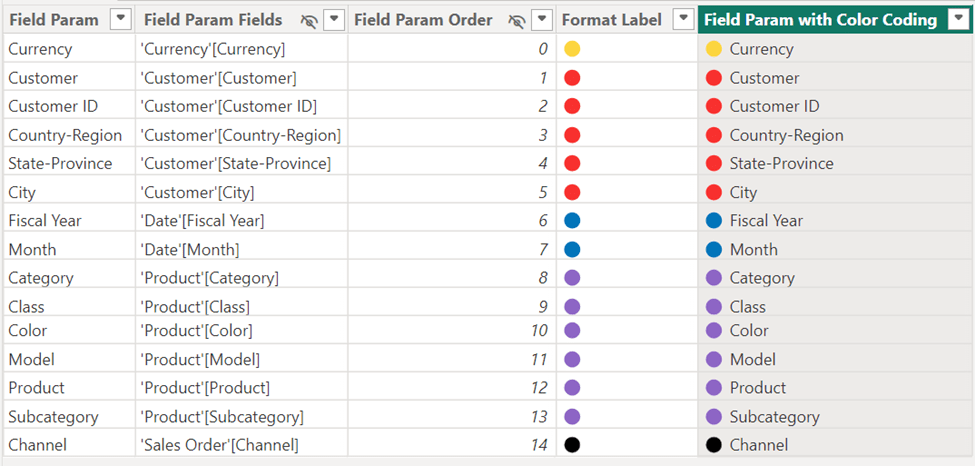
Once this is complete, our field parameter table looks like this:
Traditionally, when you added a slicer to the canvas for the field parameters, you would have added the field of [Field Param] to the slicer, but for our purposes, we want to use the new column we created that concatenates the label and the name [Field Param with Color Coding]. If you want to make sure the new column is sorted in the same order as the ordering column, select the Field Param with Color Coding column and do a Sort by column of Field Param Order. Here is how your slicer will now look:

Viola! Your users can now quickly identify which dimensions are part of the same grouping of dimensions! For a full list of emojis you can go to this site and copy whichever emoji you want from the Browser column and paste it into your DAX: Full Emoji List, v16.0 (unicode.org).
As always – thank you for Power BI’ing with me!!
