By Audrey Gerred
To say that it is an exciting time in the world of a self-professed and self-declared Power BI enthusiast and nerd, would be an understatement. Fabric, and datasets coming to mobile apps, and Edit your data models in Power BI service (preview)… OH MY! And, I almost hate to be the one to say it, but, I want to take a pause and stress the importance of fundamentals while we absorb all the updates to come. The bright and shiny new bells and whistles are so tempting, but we must remember the basics, especially with our modeling! Today, let’s look at one essential way (at a high level) to help ensure your model is running at optimal performance – Star Schema (with an occasional Snowflake dimension).
Why Star Schema?
In a Star Schema model, tables will be classified as Fact or Dimension. In the simplest of terms, it optimizes your model for performance and useability. One of your modeling goals is to design a model with tables for summarizing and tables for grouping and filtering. This normalization of the model reduces repetitious data and helps to manage model size.
Fact table(s)
- Transactional or event type data – think along the lines of sales orders, stock rates, temperature, weather events, etc.
- These tables contain key columns (unique identifiers) that relate to dimension tables
- These tables support summarization
Dimension table(s)
- Descriptive data – describes business entities – think along the lines of product, people, location, etc. information
- These tables contain the key column along with description fields related to the key
- These tables support filtering and grouping
In general, Fact tables have many rows, continue to grow over time, and need to be refreshed more frequently while Dimension tables contain a relatively small number of rows and the data does not change as often as Fact table data. When designing your model, avoid mixing dimension and fact tables together to create one large table (i.e. other than the key, if a field is part of a Dimension table, it should not be included in a Fact table). Mixing the tables together to form one table is known as denormalization and increases repetitious data.
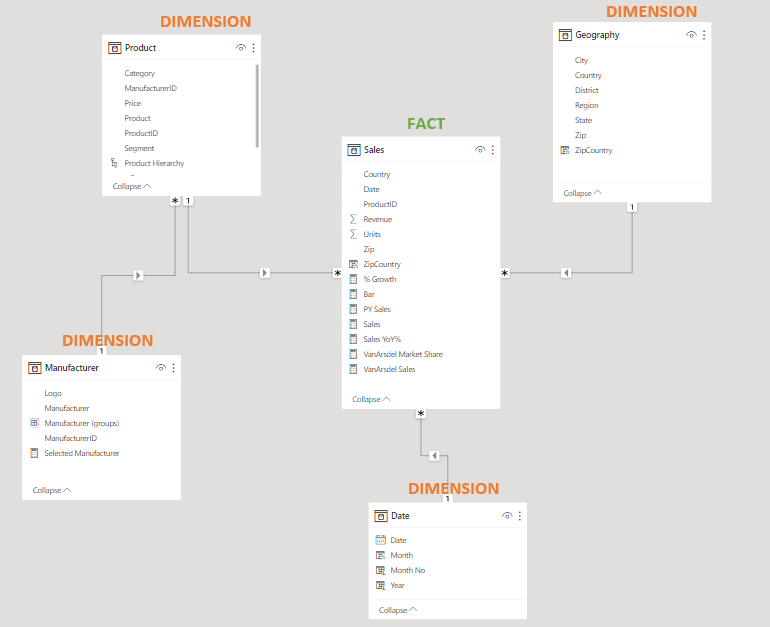
In the below example, the Fact table has a Many to one (*:1) relationship with each Dimension table through the key. From the Date Dimension table we can build visuals and filters that allow the end user to consume and slice date by variables such as name of the month, quarter of the year, week of the year, day of the week, etc. The join between Sales and Geography (based on Zip Code) allows for the filtering and grouping by many dimensions such as city, state, county, etc. Anything that can or should describe the key belongs in the dimension table related to said key.
Next Steps?
If you haven’t already, follow to stay updated on new content and try out Star Schema… go for it… normalize those models!
